
Coordinate plane graph paper (4 quadrants)
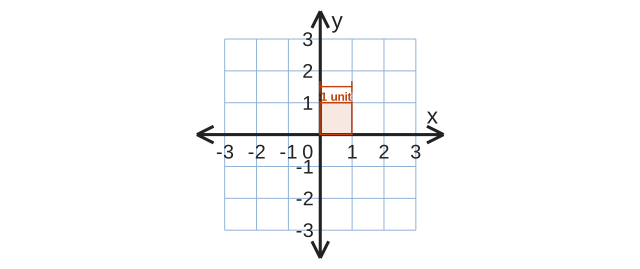
A coordinate plane is a square grid with a horizontal x axis and a vertical y axis crossing at the origin, dividing the page into four quadrants. These sheets come with numbered axes, so students can start plotting right away.
What it looks like up close
Ready-made PDF downloads
Prefer a file you can save and print later? These use the default settings shown above.
Example: graphing y = 2x − 3
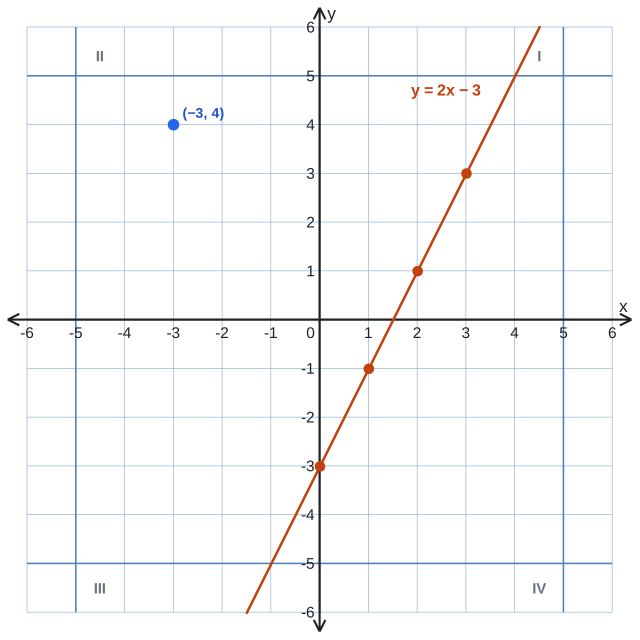
The line crosses the y axis at −3 (the y-intercept). From there, the slope of 2 means up two squares for every one square right, giving the points (1, −1), (2, 1) and (3, 3). The point (−3, 4) is three left and four up, in the second quadrant.
The four quadrants
Quadrant I is the upper right, where x and y are both positive. Numbering continues counterclockwise: Quadrant II upper left (x negative, y positive), III lower left (both negative) and IV lower right (x positive, y negative). A point such as (−3, 4) lies in Quadrant II: three squares left and four up.
Graphing linear equations, reflections, translations and transformations all happen on this grid, which is why teachers print it in sets of four or six per page for homework and quizzes.
Settings
Choose the axis range (−10 to 10 is standard; −5 to 5 for beginners, −20 to 20 for larger graphs) and how many planes appear on a page. Numbers are added automatically and thinned out when the squares get too small to label every one.
For a blank grid without axes, use 1/4 inch graph paper; for angles and circles use polar graph paper.
Activities for coordinate grids
Plotting pictures is a favorite starter: give students a list of ordered pairs, have them plot and join the points, and an image appears. Reverse it by asking students to draw a shape and write its coordinates for a partner.
For linear equations, plot the y-intercept first, then use the slope as “rise over run” to reach the next point. Reflections are easiest to see on a full four-quadrant grid: reflect (x, y) in the y axis to (−x, y), and in the x axis to (x, −y). The six-per-page layout is handy for quick warm-ups and exit tickets.
How to graph a linear equation
- Rewrite the equation in the form y = mx + b.
- Plot the y-intercept (0, b).
- Use the slope m as rise over run to find a second point.
- Repeat once more to check that the points line up.
- Draw a straight line through them with arrows at both ends.
Transformations on the coordinate plane
A translation moves every point by the same amount: (x, y) → (x + 3, y − 2). A reflection in the x axis changes the sign of y; in the y axis, the sign of x. A rotation of 90° counterclockwise about the origin sends (x, y) to (−y, x). Drawing the original and the image on the same grid in two colors makes the rule easy to see.
Recommended settings
Starting points for common uses. Pick the closest one, then adjust the size or color in the generator above.
| Use | Settings |
|---|---|
| Warm-ups and exit tickets | 6 per page, −10 to 10 |
| Homework | 4 per page, −10 to 10 |
| Beginners | 2 per page, −5 to 5 |
| Large graphs and transformations | 1 per page, −20 to 20 |
Questions
What is a 4 quadrant graph?
A coordinate plane where both axes extend into negative numbers, so the grid is split into four quadrants around the origin.
Can I print one big coordinate plane?
Yes, set “Planes per page” to 1. The grid is scaled to fill the page.
Can I change the numbers on the axes?
Set the range from 1 to 50; the axes run from minus to plus that value.
Can I print coordinate planes without numbers?
Yes—untick “Labels” for blank axes.
Which quadrant is (4, −2) in?
Quadrant IV: x is positive and y is negative.