
Polar graph paper
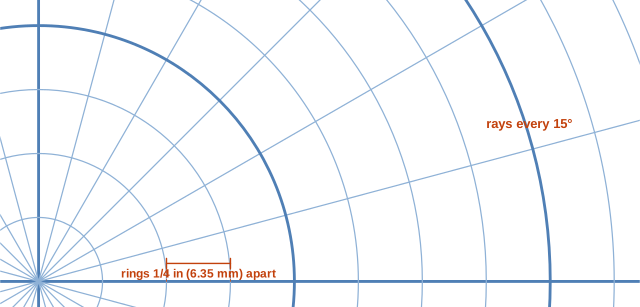
Polar graph paper has concentric circles centered on the pole and rays at equal angles. Points are plotted by distance r and angle θ instead of x and y, which makes curves such as roses, cardioids and spirals easy to draw.
What it looks like up close
Ready-made PDF downloads
Prefer a file you can save and print later? These use the default settings shown above.
Example: a cardioid and a rose curve
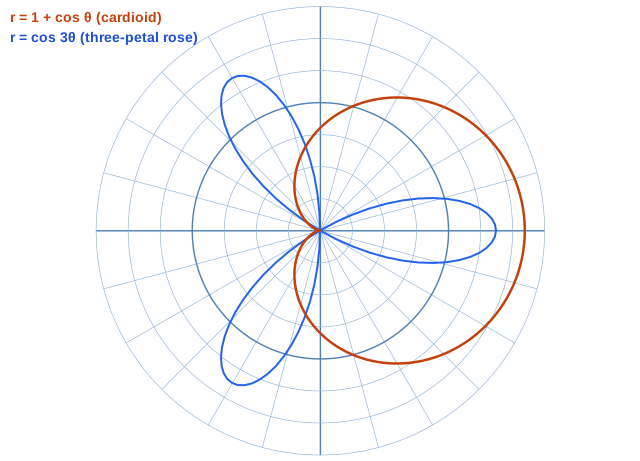
The cardioid reaches its maximum r = 2 at 0° and shrinks to the pole at 180°. The three-petal rose has petals centered on 0°, 120° and 240°; between them the curve passes through the pole. Both were plotted from a table of values every 15°, using the printed rays.
Plotting in polar coordinates
To plot (r, θ), go along the ray at angle θ—measured counterclockwise from the 0° ray on the right—and count r circles out from the center. A negative r is plotted on the opposite ray. For r = 2 + 2 cos θ, make a table every 15° and join the points with a smooth curve to get a cardioid.
The rays are labeled in degrees. If your class works in radians, 15° is π/12 and 30° is π/6, so every ray still falls on a standard angle.
Other uses
Engineers use polar grids for antenna radiation patterns and microphone pickup patterns; navigators and orienteers for bearings; and artists for mandalas and circular designs. Choose 5° rays for precise angles or 30° for a simpler page.
Common polar curves to try
Circles through the pole: r = 2a cos θ. Cardioids: r = a(1 + cos θ). Rose curves: r = a cos(kθ), which have k petals when k is odd and 2k petals when k is even. Archimedean spirals: r = aθ, where each turn moves out by the same distance—easy to see as the curve crosses the rings at equal steps.
Make a table of θ and r first, using the ray angles printed on the sheet, then plot and join the points smoothly. Rays every 15° are usually enough; switch to 5° for spirals and narrow petals.
Degrees and radians on the sheet
With rays every 15°, each ray is a multiple of π/12 radians: 30° = π/6, 45° = π/4, 60° = π/3 and 90° = π/2. Choosing 5° rays gives multiples of π/36. You can write radian labels beside the degree labels by hand, or untick the labels and add your own.
Bold rings every four rings act like the bold lines on square graph paper, helping you count larger radii quickly.
How to plot a polar equation
- Make a table with θ every 15° (or 5° for detailed curves).
- Calculate r for each angle; note where r becomes negative.
- Choose how many rings represent one unit of r.
- Plot each point on its ray; plot negative r on the opposite ray.
- Join the points in order of θ with a smooth curve.
Converting between polar and Cartesian
A point (r, θ) has Cartesian coordinates x = r cos θ and y = r sin θ. Going the other way, r = √(x² + y²) and θ = tan⁻¹(y/x), adjusted for the quadrant. Plotting the same point on polar paper and on a coordinate plane is a good way to check a conversion.
Recommended settings
Starting points for common uses. Pick the closest one, then adjust the size or color in the generator above.
| Use | Settings |
|---|---|
| Polar equations in precalculus | 1/4 inch rings, 15° rays, labels on |
| Spirals and narrow petals | 1/4 inch rings, 5° rays |
| Antenna or microphone patterns | A4 or Letter, 10° rays, bold ring every 5 |
| Mandalas and circular art | Labels off, 30° rays, light gray |
Questions
Where is 0° on polar graph paper?
On the ray pointing right from the center. Angles increase counterclockwise, so 90° points up.
How many circles are there?
That depends on the ring spacing; at 1/4 inch on Letter paper there are 14 rings. Every fourth ring is bold.
Can I remove the degree labels?
Yes, untick “Labels” in the generator.
Can I get polar paper with radians?
The printed labels are in degrees; with 15° rays each ray is a multiple of π/12, so radian values are easy to write in.
Can I print smaller polar grids, several per page?
Not yet—each page has one polar grid. Increase the ring spacing for a simpler grid.