
2 mm graph paper
2 mm graph paper is the standard sheet for science graphs in UK schools: small 2 mm squares, a bold line every centimeter, and room to plot accurately. Exam boards expect graphs drawn on paper like this.
Print at 100% / Actual size so the squares measure exactly. Printing help
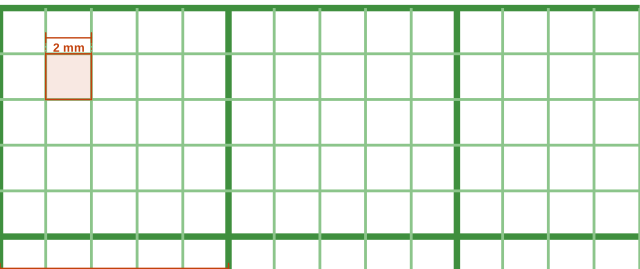
What it looks like up close
Ready-made PDF downloads
Prefer a file you can save and print later? These use the default settings shown above.
How many squares per page
Each square is 0.0787 in (2 mm). With the default margin, a sheet holds:
| Paper | Portrait (across × down) | Landscape (across × down) |
|---|---|---|
| US Letter | 97 × 129 | 129 × 97 |
| A4 | 95 × 138 | 138 × 95 |
| US Legal | 97 × 167 | 167 × 97 |
| Tabloid 11×17 | 129 × 205 | 205 × 129 |
| A3 | 138 × 199 | 199 × 138 |
Example: a Hooke's law graph
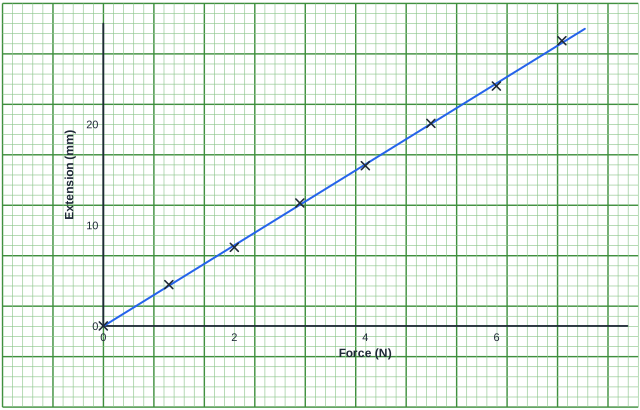
The line passes through the origin and the points lie close to it, showing that extension is proportional to force. The gradient—about 4 mm per newton—is read from two points on the line far apart, which is the method exam mark schemes expect.
Drawing a good science graph
Put the independent variable on the x axis and use more than half of the grid in each direction. With 2 mm squares an A4 sheet gives roughly 95 × 138 squares, so choose a scale of 1, 2 or 5 units per centimeter (five squares) and label every bold line.
Plot each point with a small cross, then draw a single smooth curve or ruled line of best fit. The fine grid lets you read intercepts and gradients to the nearest half square.
Color and contrast
Exam graph paper is traditionally printed in green or orange so pencil marks stand out. The default here is green with darker centimeter lines; switch to blue or gray if you prefer.
For engineering drawings that need every millimeter, use 1 mm graph paper; for a coarser imperial grid use 10 squares per inch.
Common mistakes to avoid
Examiners mark down graphs that use less than half the grid, axes without units, and scales that go up in awkward steps such as 3 or 7 per centimeter. Start the axes at zero only if the data is close to zero; otherwise a false origin gives a larger, more accurate plot. Draw the line of best fit with a ruler so it passes through the middle of the points, not from point to point.
How to draw an exam-standard graph
- Use a sharp pencil and a ruler for axes and straight lines.
- Choose scales so the data fills more than half of the grid in both directions.
- Label both axes with the quantity and the unit, e.g. Force / N.
- Plot points as small crosses accurate to half a small square.
- Draw one smooth curve or one straight line of best fit—never join the dots.
Why 2 mm and not 1 mm?
2 mm squares are the compromise exam boards settled on: fine enough to plot to ±1 mm, coarse enough that students can count squares quickly and printers reproduce them clearly. 1 mm paper is better for engineering drawings, but it is slow to count and easy to misread under exam pressure.
Compare with nearby sizes
Squares per page with 1/4 inch margins, portrait. All sizes are compared on the home page.
| Grid | Square (in) | Square (mm) | US Letter | A4 |
|---|---|---|---|---|
| 1 mm | 0.039 | 1 | 203 × 266 | 197 × 284 |
| 2 mm | 0.079 | 2 | 101 × 133 | 98 × 142 |
| 10 per inch | 0.1 | 2.54 | 80 × 105 | 77 × 111 |
| 1/8 inch | 0.125 | 3.18 | 64 × 84 | 62 × 89 |
Questions
Why does 2 mm graph paper have bold lines every 1 cm?
Five 2 mm squares make one centimeter. Bold centimeter lines make it quick to count and label the scale.
Is this the same paper used in GCSE exams?
The grid is the same: 2 mm squares with 1 cm and sometimes 2 cm bold lines. Print at 100% to keep the dimensions exact.
Can I add a heavier line every 2 cm?
Set “Bold line every” to 10 to emphasize every 2 cm instead of every centimeter.
What color is 2 mm graph paper?
Usually green or blue; the generator uses green by default.
How many 2 mm squares fit on A4?
With 10 mm margins, 95 × 138 squares.