
Log-log graph paper
Log-log (full logarithmic) paper has logarithmic scales on both axes. Power laws—relationships of the form y = a·xⁿ—become straight lines, and the slope of the line is the exponent n.
Image for Word, Google Docs or note apps: ·
Print at 100% / Actual size so the squares measure exactly. Printing help
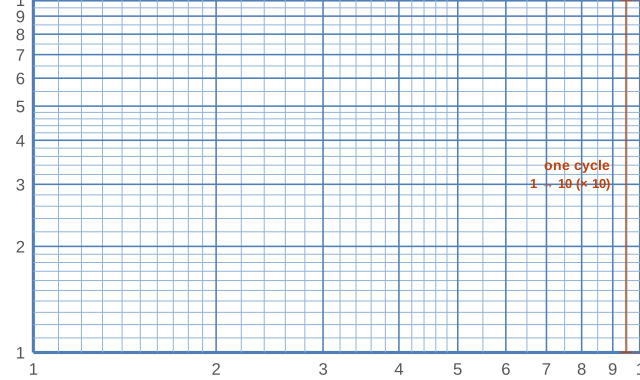
What it looks like up close
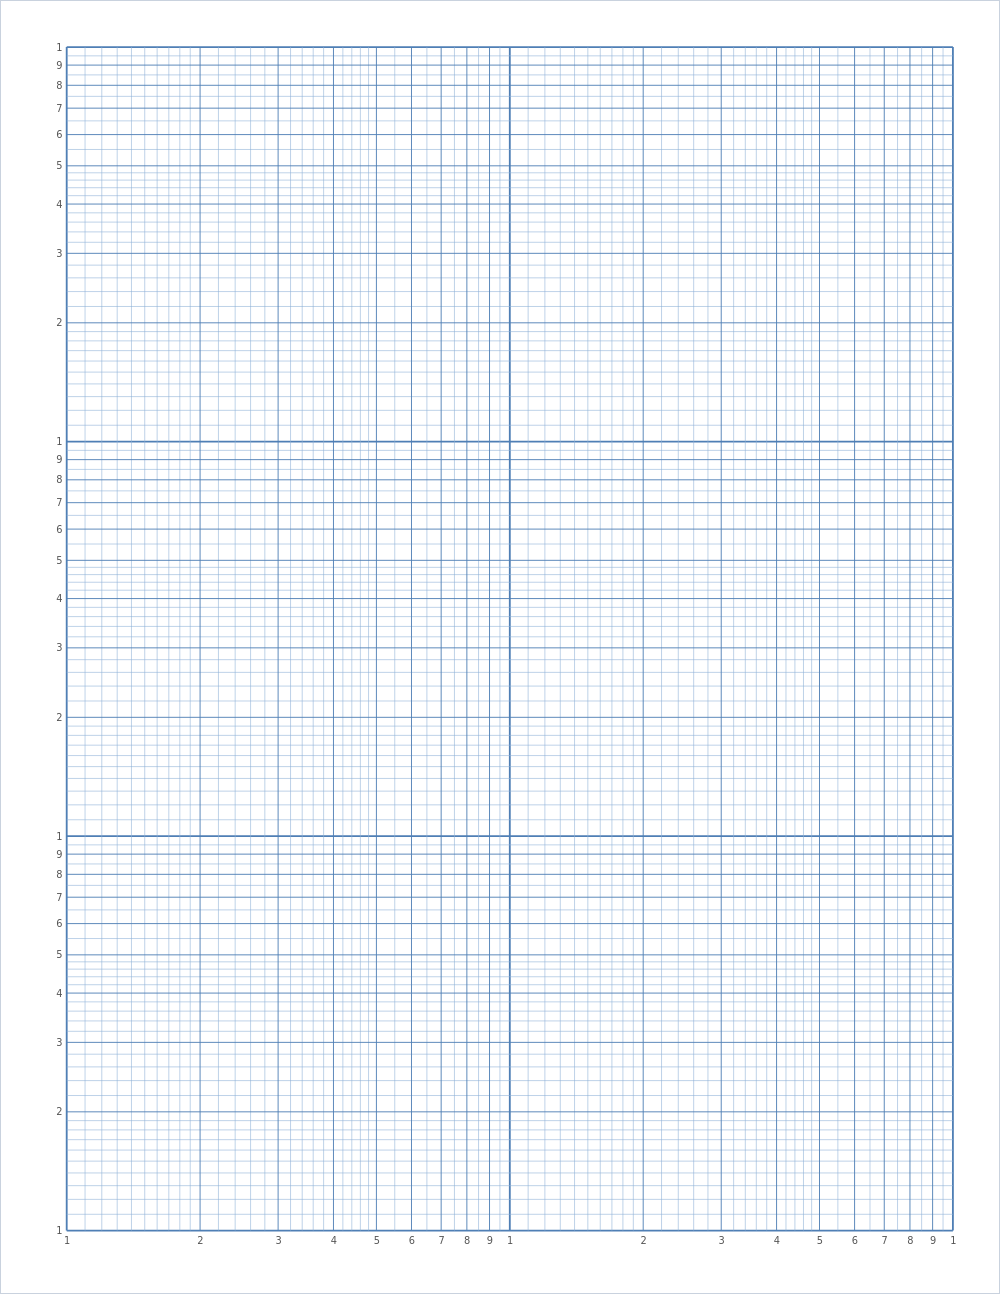
Ready-made PDF downloads
Default settings, ready to print.
Example: Kepler's third law
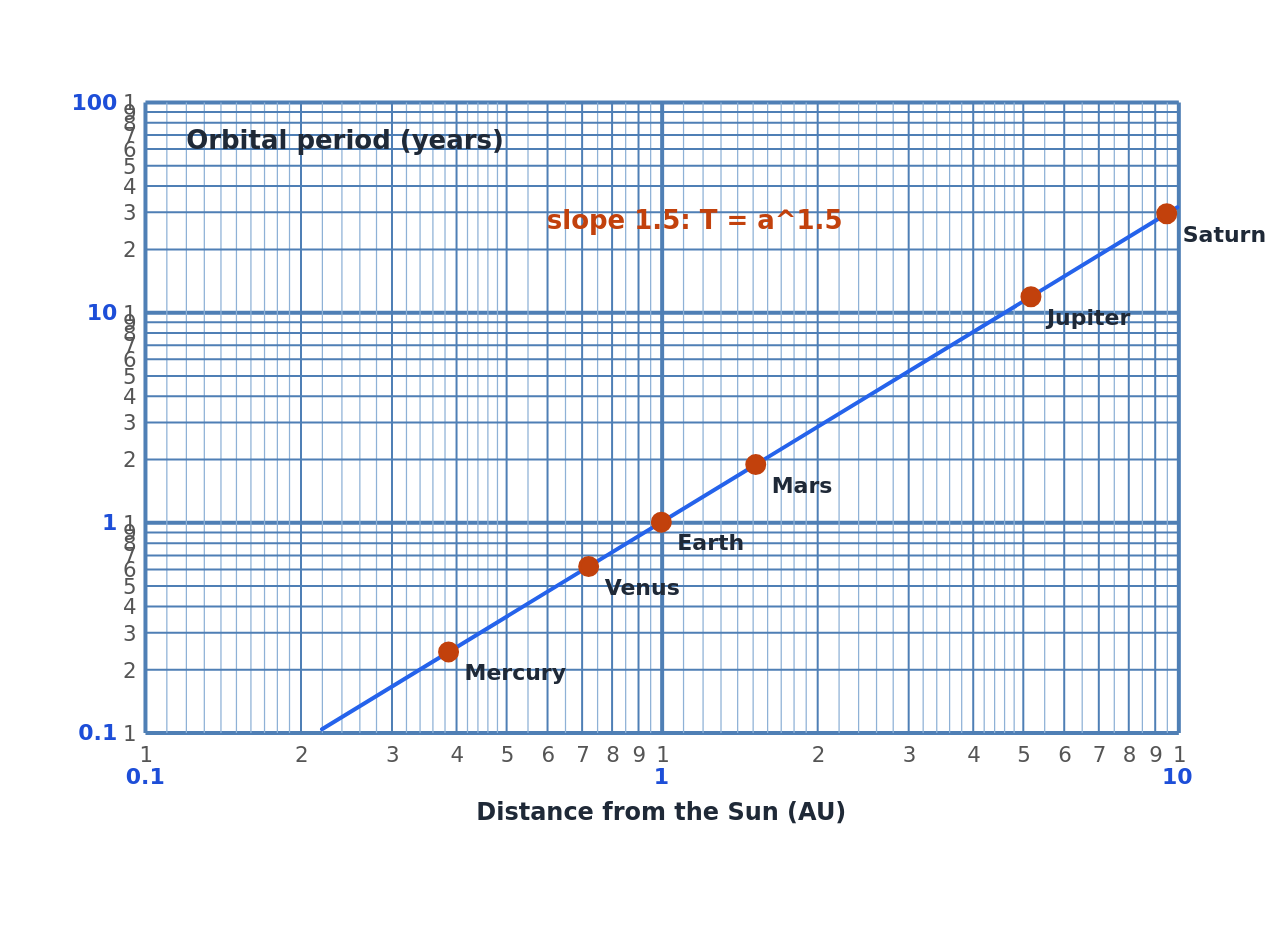
Mercury orbits at 0.387 AU in 0.241 years, Saturn at 9.54 AU in 29.5 years. On ordinary paper the inner planets crowd into a corner; on log-log paper all six spread out and fall on one line. Its slope—1.5 when measured between any two planets—is the exponent in T = a^1.5.
Why power laws become straight lines
Taking logarithms of y = a·xⁿ gives log y = log a + n·log x: a straight line in log y against log x, with slope n and intercept log a. Log-log paper does the logarithms for you. If the cycles on both axes are the same length, you can measure the slope with a ruler; if they differ, compute it from two points as (log y₂ − log y₁) ÷ (log x₂ − log x₁).
This is how scientists recognise power laws in data. A slope of 2 means y grows with the square of x, a slope of −1 means y is inversely proportional to x, and a slope of 0.5 is a square root.
Setting up the axes
Choose the cycles for each axis separately from the range of your data: two cycles on x for values from 0.3 to 10, three on y for 0.2 to 30, and so on. Label each cycle's 1 with its power of ten. Because both scales are logarithmic, neither axis can show zero or negative values.
How to find a power law on log-log paper
- Choose the number of cycles for x and y from the range of each variable.
- Label the 1 of each cycle with its power of ten on both axes.
- Plot the data points.
- If they lie on a straight line, draw it; the relationship is a power law.
- Measure the slope between two points far apart: (log y₂ − log y₁) ÷ (log x₂ − log x₁) is the exponent.
Where log-log plots appear
Biologists plot metabolic rate against body mass, engineers plot material fatigue against the number of load cycles, and physicists check inverse-square laws—all on log-log paper. When one variable spans several orders of magnitude but the other does not, semi-log paper is usually the better choice.
Recommended settings
Starting points for common uses. Pick the closest one, then adjust the size or color in the generator above.
| Use | Settings |
|---|---|
| Power laws in physics labs | 3 × 3 cycles, US Letter |
| Wide x range, narrow y range | 4–5 cycles on x, 2 on y, landscape |
| Single-decade detail | 1 × 1 cycle for the finest subdivisions |
Questions
What is log-log paper used for?
Finding and checking power laws (y = a·xⁿ), plotting data that spans several orders of magnitude on both axes, and engineering charts such as fatigue (S–N) curves and frequency responses.
How do I find the slope on log-log paper?
Pick two points on the line and divide the difference of the logs of y by the difference of the logs of x. With equal cycle lengths on both axes you can also measure rise over run with a ruler.
Can I have different numbers of cycles on each axis?
Yes. Set “Cycles (x)” and “Cycles (y)” independently, from 1 to 6 each.
What does a slope of −1 mean on log-log paper?
y is inversely proportional to x: doubling x halves y.
Do both axes need the same number of cycles?
No. Choose each from its own data range; only the slope calculation must use the logs rather than ruler distances if the cycle lengths differ.
Save it for later
 Pin this Log-log paper to a board.
Save to Pinterest