
Semi-log graph paper
Semi-log (semi-logarithmic) paper has a logarithmic scale on one axis and an ordinary linear scale on the other. Anything that grows or decays by a constant factor—bacteria, radioactive decay, compound interest—plots as a straight line on it.
Image for Word, Google Docs or note apps: ·
Print at 100% / Actual size so the squares measure exactly. Printing help
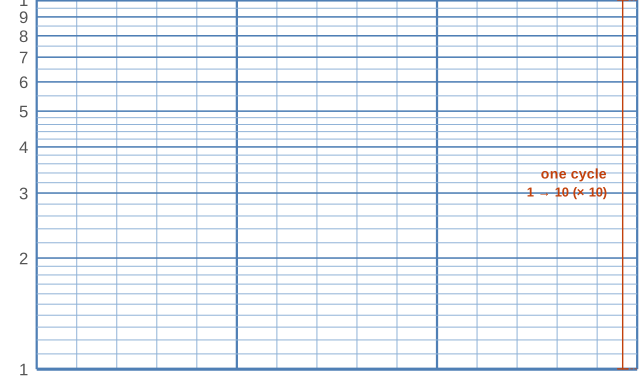
What it looks like up close
Ready-made PDF downloads
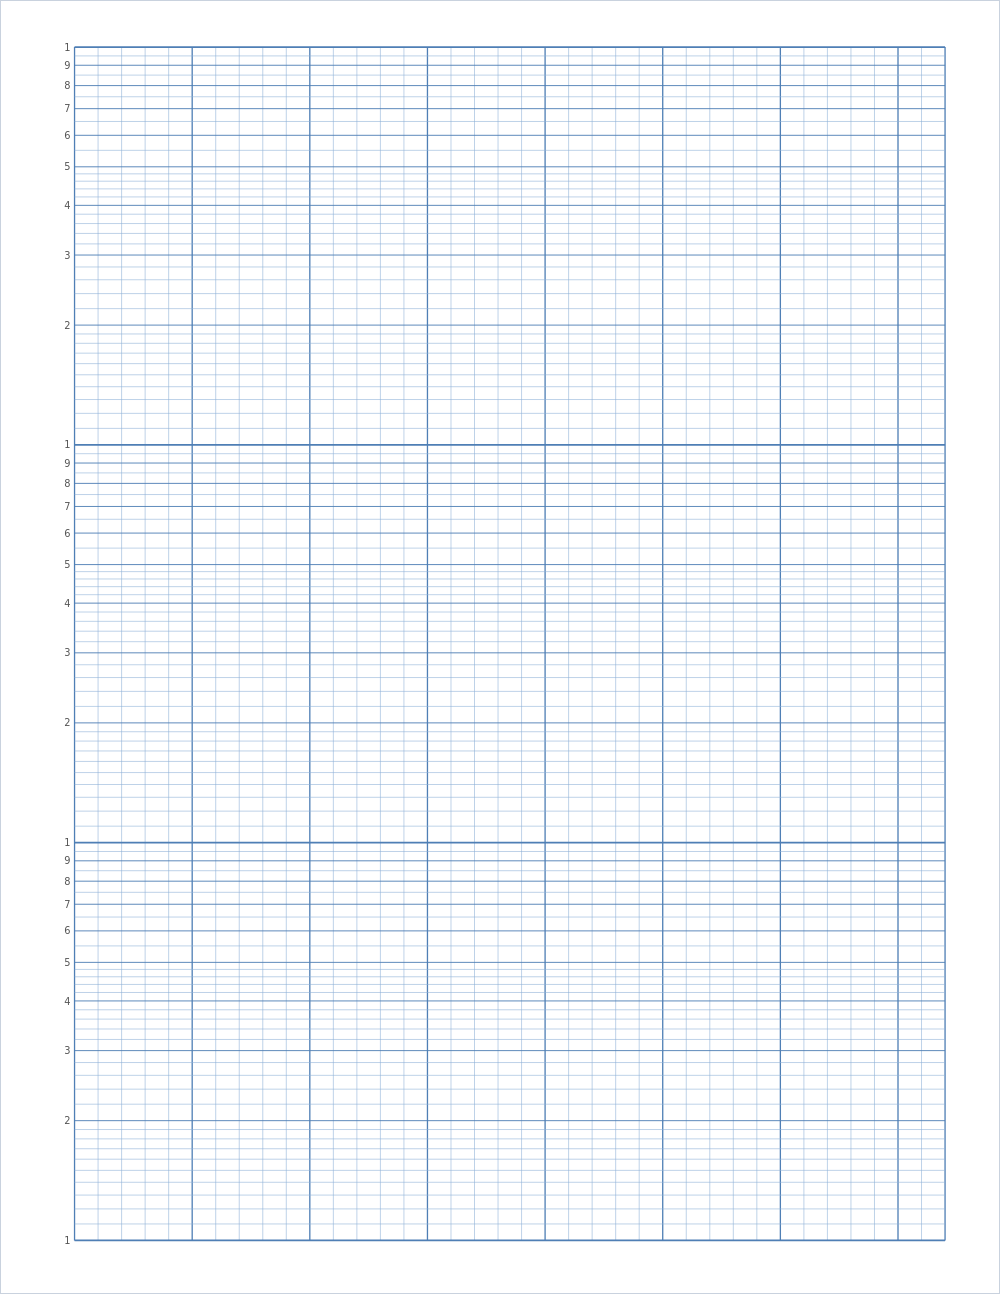
Default settings, ready to print.
Example: bacteria doubling every 20 minutes
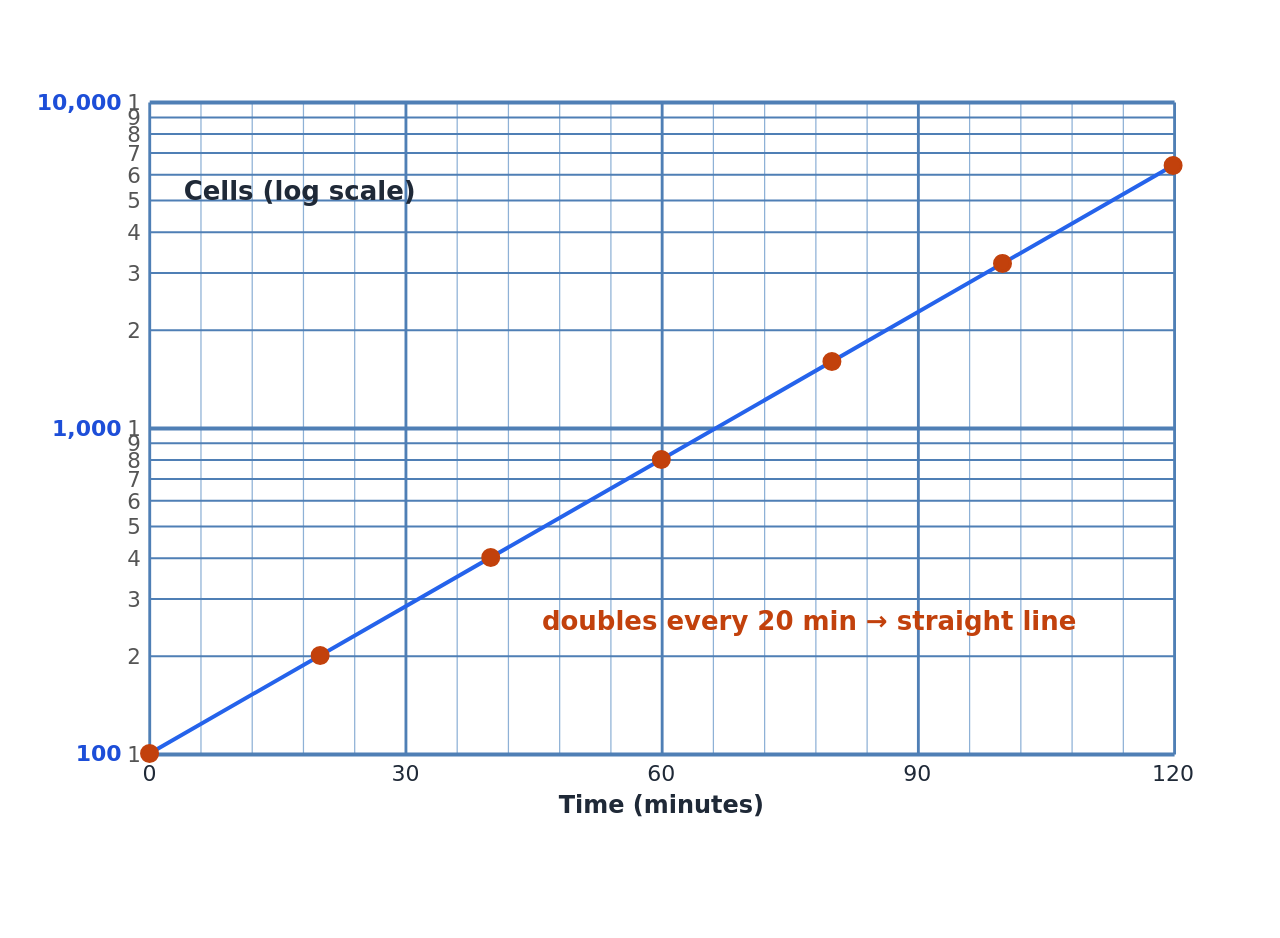
On ordinary graph paper this growth curves sharply upward and the early points are squashed near zero. On semi-log paper each doubling moves the same distance up, so the seven points line up. The steepness of the line is the growth rate: here the count rises by a factor of 64 in 120 minutes.
How a log axis works
On the log axis, equal distances mean equal ratios, not equal differences. The distance from 1 to 10 is the same as from 10 to 100 or from 100 to 1000. Each of those stretches is one cycle (or decade). Three-cycle paper therefore spans a factor of 1000: 1 to 1000, or 0.01 to 10, or 50 to 50,000 if you start at 50.
Inside a cycle the lines bunch up toward the top: 2 is 30% of the way from 1 to 10, 5 is 70%, and 9 sits just below the next cycle. The numbers 1–9 are printed along the edge; write the power of ten for each cycle next to its 1. There is no zero on a log scale—the axis goes down forever without reaching it.
Choosing the number of cycles
Count how many powers of ten your data spans and round up. Values from 3 to 2,400 cover 3 to 3,000, which is three cycles (1–10, 10–100, 100–1,000) plus a little: use four. With fewer cycles each one is taller and easier to read; with more you fit a wider range. The generator offers 1 to 6 cycles on the vertical or horizontal axis.
The linear axis works like ordinary graph paper. The default is five divisions per inch with a bold line every inch; change the division size or units in the settings.
How to plot exponential data on semi-log paper
- Find the smallest and largest values and count the powers of ten between them.
- Choose that many cycles and label the 1 at the start of each cycle (for example 100, 1,000, 10,000).
- Put time or the other linear variable on the linear axis with an even scale.
- Plot each point by finding its first digit on the log scale inside the right cycle.
- Draw the best straight line; if the points curve, the change is not purely exponential.
Reading growth rates and half-lives
For a straight line on semi-log paper, the time it takes to double (or halve) is the same everywhere on the line. Find two points one doubling apart—say 200 and 400—and read the time between them; that is the doubling time. For decay, the same method gives the half-life. Engineers use semi-log paper with the log scale on the x axis for frequency plots, where each cycle is a decade of frequency.
Recommended settings
Starting points for common uses. Pick the closest one, then adjust the size or color in the generator above.
| Use | Settings |
|---|---|
| Exponential growth or decay over time | Log axis vertical, cycles = powers of ten in the data |
| Bode plot / frequency response | Log axis horizontal, 3–5 cycles, landscape |
| Lab report graph | 3 cycles, linear divisions 0.2 in, bold every inch |
| Metric version | A4, linear divisions 5 mm, bold every 2 |
Questions
What is semi-log graph paper used for?
Plotting quantities that change by a constant factor—exponential growth and decay, sound levels, pH, bacteria counts, investment growth—so that they appear as straight lines, and data covering a very wide range.
What does “3 cycle” mean?
The log axis covers three powers of ten, for example 1 to 1,000 or 0.1 to 100. Each cycle is a factor of 10.
Can the log scale be on the x axis?
Yes. Set “Log axis” to Horizontal (x). That layout is used for frequency plots such as Bode diagrams.
Why is there no zero on semi-log paper?
Because log 0 is undefined: each step down the log axis divides by ten, so the scale never reaches zero. Start the axis at a convenient power of ten below your smallest value.
Is semi-log paper the same as semi-logarithmic paper?
Yes. It is also called single-log or log-linear paper.
Save it for later
 Pin this Semi-log paper to a board.
Save to Pinterest